NASDAQ Carves A Meaningful Top Around 10785
10 July 2020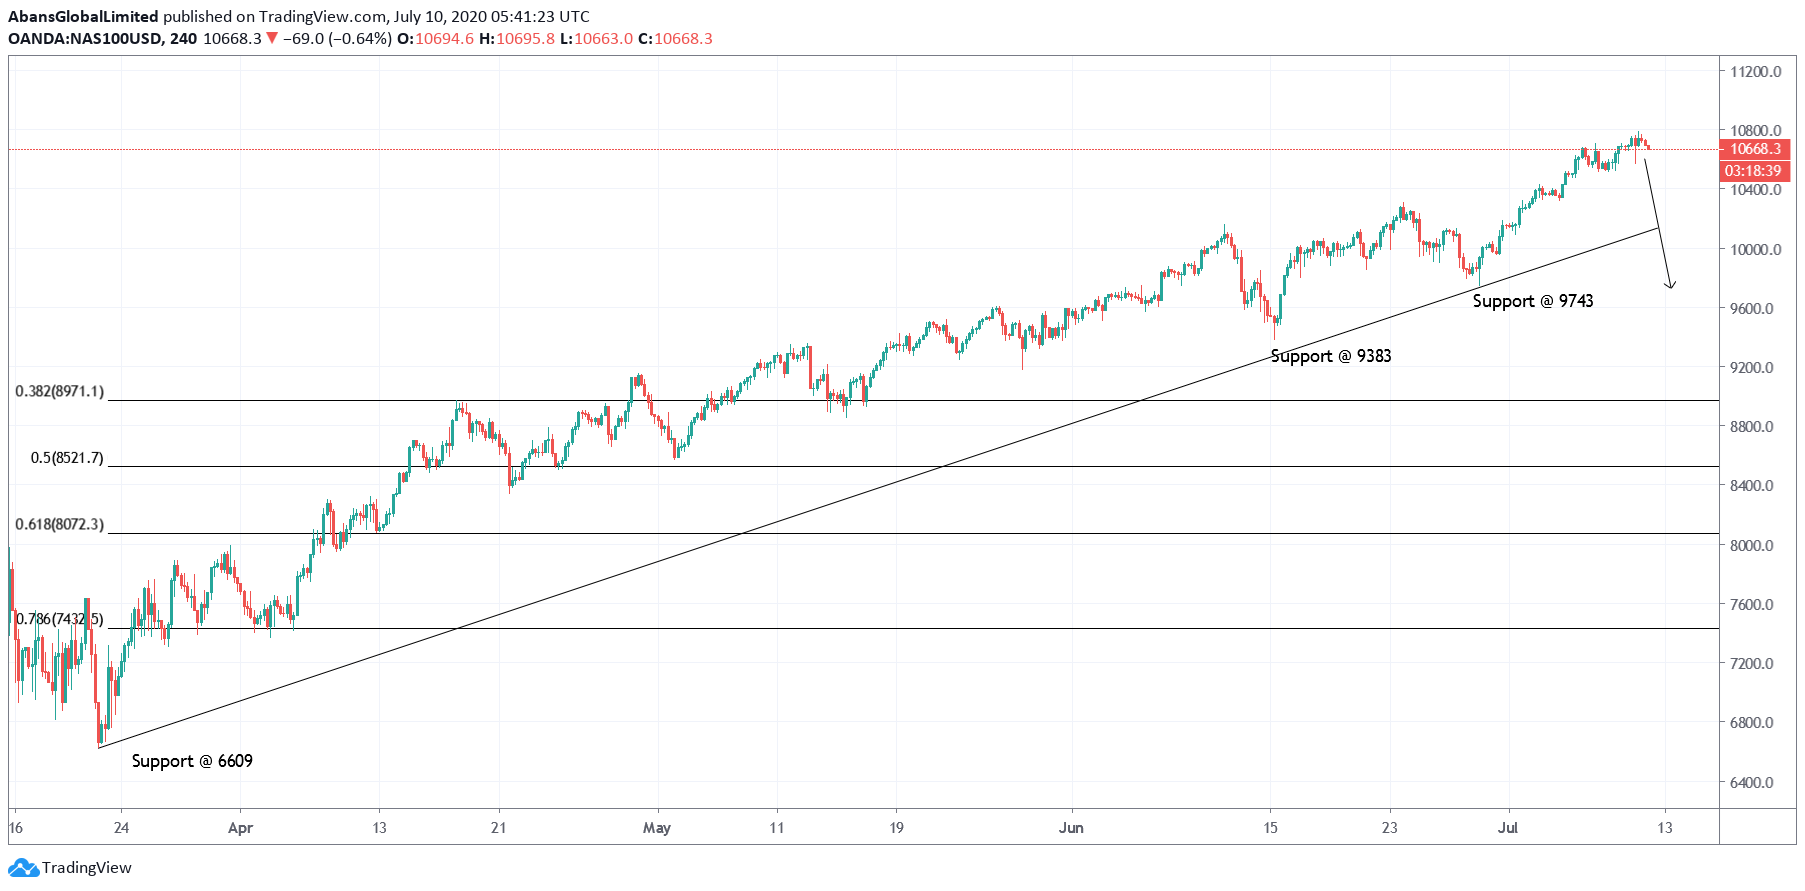
NASDAQ might have carved a meaningful to around 10785 yesterday. The index has been printing higher highs and higher lows since the mid February-March collapse towards 6609 levels. NASDAQ had religiously remained in control of bulls until 10785 highs yesterday.
The indice has been trading lower towards 10670 levels as we prepare to publish this update. It cannot be confirmed right now, but potential remains for a bearish reversal soon. A short term support is seen around 10572 and a break below would confirm the first step.
As per the 4 hour chart displayed here, major initial support comes in around 9743 levels. A break below that support would be extremely encouraging for bears. Also note that NASDAQ, for the first time will be seen in the sell zone of its support trend line.
Looking into the potential wave structure, NASDAQ has been in a religious up trend since 6609 lows on March 22, 2020. The technology indice has remain in complete control of bulls and has been carving higher highs and higher lows since then.
We have not labelled the potential wave counts here but it seems a clear impulse wave since 6609 through 10785 levels respectively.
Prepared by
Technical Analysis Team
Trade with
Abans Global
- Authorised and Regulated by FCA
- Customer Support 24/5
- Low Spread & Commission
- Instant Execution
- No Dealing Desk