WTI Crude Might Have Carved Potential Top Around $43.50
11 August 2020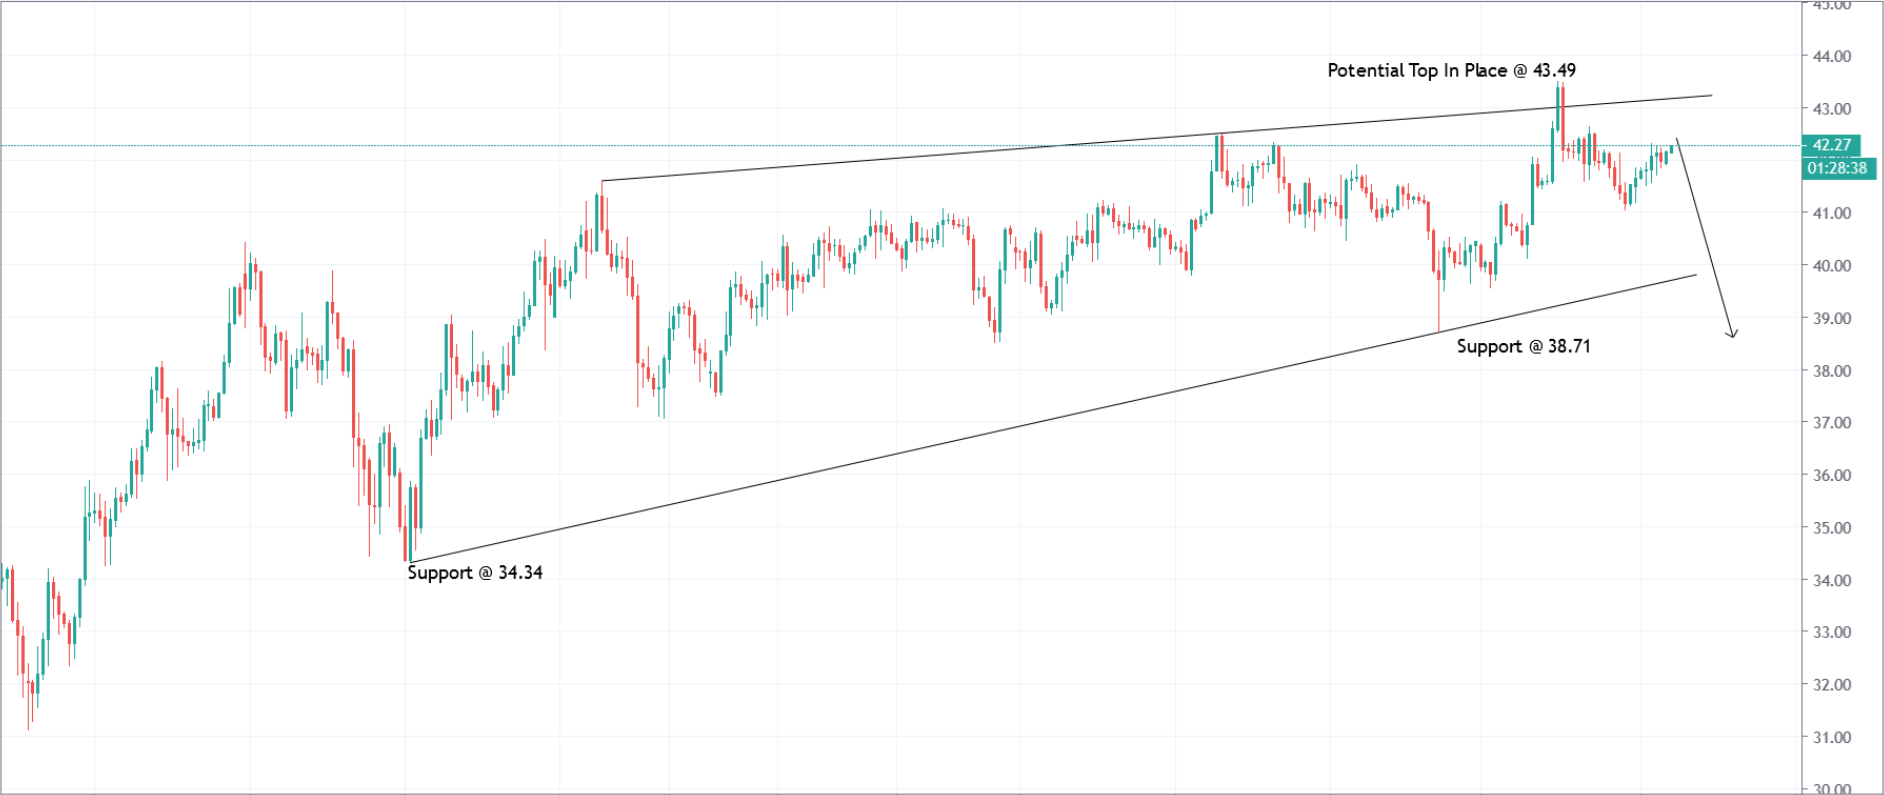
WTI Crude had managed to print yet another high over the last week around $43.50 levels. The commodity might have completed an ending diagonal structure between $34.34 and $43.50 as shown on the chart here. A break below $38.71 would confirm.
WTI Crude probable wave counts are as follows: The commodity has been rising from sub $0.01 historic lows since April 2020. Bulls have managed to carve a series of higher highs and higher lows through $43.50 levels respectively.
The final wave looks to be an ending diagonal that might have begun around $34.34 levels. An ending diagonal is of 5 waves, and each wave sub-divides into 3 waves. If the above proposed wave counts hold well, DAX might have terminated around $43.50 levels.
Also note that a reversal would first break below $38.71 support and push through $34.34 in the next few trading sessions. WTI Crude may produce a much deeper correction and retrace towards the fibonacci 0.618 level of the entire rally, passing through $16.75 levels.
The initial drop of a corrective structure might find support around $27.07 mark, which is fibonacci 0.382 retracement level of the entire rally. A drop below $38.71 would confirm a meaningful top is in place and trigger further selloff.
Traders might remain flat for now and allow price action to break below $38.71 mark. They might be inclined to sell on rallies thereafter with protective stops above $43.50 and projected target towards $27.00 levels, going forward.
Prepared by
Technical Analysis Team
Trade with
Abans Global
- Authorised and Regulated by FCA
- Customer Support 24/5
- Low Spread & Commission
- Instant Execution
- No Dealing Desk